Feeling lost in a sea of numbers? SOCS – Shape, Outliers, Center, and Spread – is your compass and map for navigating the world of data. This framework helps you unravel the story hidden within your datasets, transforming you into a data detective.
Visualizing Data’s Story: Shape, Outliers, Center, and Spread
Shape: The Data’s Silhouette
Imagine a mountain range. Some peaks are symmetrical, others jagged. Similarly, data has a “shape.” Is it a bell curve, suggesting a normal distribution? Perhaps it’s skewed, like a slide, with a longer tail on one side, indicating uneven distribution. Recognizing the shape offers a first glimpse into your data’s personality. Histograms provide a visual snapshot, revealing whether the distribution is symmetrical, skewed, uniform (like a flat plateau), or multimodal (with multiple peaks).
Outliers: The Data Mavericks
Within a dataset, some points might stand out like a giraffe in a group of cats. These are outliers—data points that deviate significantly from the norm. They could be genuine anomalies, measurement errors, or natural extremes. Box plots visually highlight outliers, marking them as separate points. Mathematically, the Interquartile Range (IQR) method helps identify them. Values falling significantly outside the IQR (typically more than 1.5 times the IQR below the first quartile or above the third quartile) are probably outliers. Addressing outliers is crucial, as they can skew analyses.
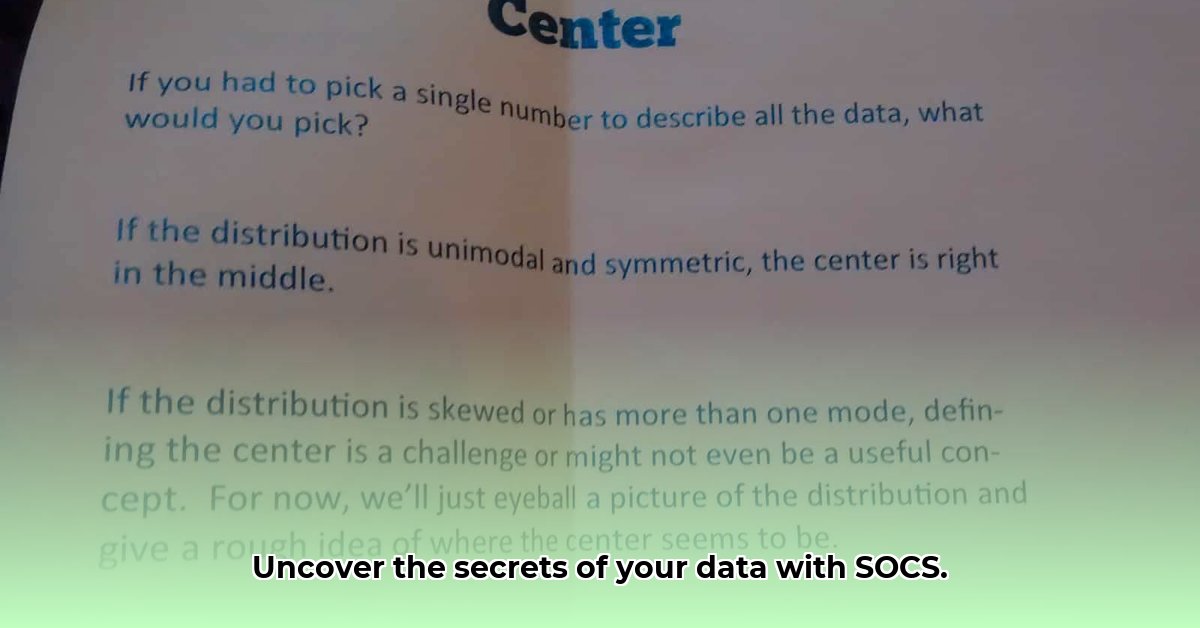
Center: Finding the Data’s Heart
Measures of center pinpoint the “typical” value. The mean (average) sums all values and divides by the count. The median represents the middle value when data is ordered. The mode is the most frequent value. Each measure tells a slightly different story. For symmetrical distributions, the mean and median are often close. For skewed data or data with outliers, the median is a more robust representation of the “typical” value.
Spread: Gauging Data’s Reach
Spread, or variability, describes how stretched or squeezed the data is. Imagine comparing the heights of students in a class versus the heights of people in a city. The city’s data would be more spread out. The range (difference between largest and smallest values) offers a basic measure. The IQR provides a more nuanced view, focusing on the middle 50% of the data. The standard deviation quantifies the average deviation from the mean; a larger standard deviation suggests wider spread.
SOCS in Action: Unmasking Data’s Secrets with a Real-World Example
Let’s apply SOCS to daily temperatures over a week: 20, 22, 21, 23, 15, 22, 24°C.
Shape: A histogram would likely reveal a slightly skewed distribution, possibly with a tail towards lower temperatures due to the 15°C reading.
Outliers: While 15°C is lower, it’s likely not an outlier in this small dataset. Further investigation might reveal the reason for this cooler day.
Center: The mean is approximately 21°C. The median and mode are both 22°C. The slightly lower mean could be due to the 15°C value.
Spread: The range is 9°C (24 – 15). The IQR and standard deviation would offer more precise insights into temperature fluctuations.
SOCS: A Foundation for Data Exploration and Further Research
SOCS provides a powerful initial framework for understanding data. It’s a starting point, not the final destination. More advanced techniques might be necessary for deeper insights. The dynamic nature of statistics means ongoing research continually refines our understanding. While current methods offer valuable tools, they’re subject to ongoing debate and refinement within the statistical community.
Understanding Data Distribution Shapes: A Deeper Dive
Data distributions, like crowds at a concert—evenly dispersed, clustered near the stage, or gathered around food trucks—reveal patterns. SOCS guides us in understanding these patterns.
Shape: Visualizing the data’s form—bell curve (normal distribution), skewed (right skew with a tail towards higher values, like income distribution; left skew with a tail towards lower values), uniform (equal probability for each value), or multimodal (multiple peaks).
Outliers: Identifying the data mavericks using visual inspection or calculations like the 1.5*IQR rule, considering whether they are genuine extremes, errors, or valuable insights.
Center: Locating the data’s core using the mean (sensitive to outliers), median (robust to outliers), and mode (most frequent value). Choosing the appropriate measure depends on the data’s characteristics and research questions.
Spread: Quantifying data dispersion with the range, IQR (middle 50%), standard deviation (average deviation from the mean), and variance.
Identifying Outliers: Using the 1.5*IQR Rule and Other Methods
Outliers in SOCS can indicate a model needing adjustment, data entry errors, or genuinely unique observations. The 1.5*IQR rule is a useful tool:
Calculate Q1 and Q3: The medians of the lower and upper halves of the ordered data.
Beyond the 1.5IQR rule, methods like Z-scores and modified Z-scores offer alternative approaches, each with its own strengths and limitations. The ongoing research emphasizes that “outlier” is context-dependent, and identifying them is just the first step. Investigating the why* is crucial.
Measures of Center: Mean, Median, and Mode – Choosing the Right Tool
These measures offer different perspectives on “typical” values:
Mean: The average, sensitive to outliers.
Median: The middle value, robust to outliers.
Mode: The most frequent value.
The best choice depends on the data and research question. The relationship between these measures also reveals information about the data’s shape. For example, mean > median > mode suggests a right skew.
Measure
Advantages
Disadvantages
Mean
Easy to calculate, considers all data points
Sensitive to outliers, not ideal for skewed data
Median
Resistant to outliers, suitable for skewed data
Doesn’t consider all data points
Mode
Simple, useful for categorical data
Might not exist or be multiple, can oversimplify
Ongoing research continually refines statistical methods, highlighting the dynamic nature of the field.
This comprehensive guide provides a solid foundation for understanding and applying SOCS in data analysis, acknowledging the complexities and ongoing evolution of statistical methods. It encourages a nuanced approach, recognizing that data analysis is a journey of discovery, and SOCS is a valuable tool for that exploration.
I am a writer who loves renewable energy, with a focus on sustainable living, renewable energy, and eco-friendly innovation. With a passion for environmental awareness and a desire to explore the latest trends in green technology, corporate sustainability, and climate action. Through in-depth storytelling